→ Save 40% with code LUCK24 on IT Professional Programs & Bundles
→ Save 25% with code LUCK24CC on e-Learning Courses & Certifications & SkillCreds
→ Save 25% with code LUCK24ILT on Instructor-led Courses
Learn more at Linux Foundation Training
Learn more at Linux Foundation Training
The AsyncAPI specification emerged in response to the growing need for a standardized and comprehensive framework that addresses the challenges of designing and documenting asynchronous APIs. It is a collaborative effort of leading tech companies, open source communities, and individual contributors who actively participated in the creation and evolution of the AsyncAPI specification.
Various approaches exist for implementing asynchronous interactions and APIs, each tailored to specific use cases and requirements. Despite this diversity, these approaches fundamentally share a common baseline of key concepts. Whether it’s messaging queues, event-driven architectures, or other asynchronous paradigms, the overarching principles remain consistent.
Leveraging this shared foundation, AsyncAPI taps into a spectrum of techniques, providing developers with a unified understanding of essential concepts. This strategic approach not only fosters interoperability but also enhances flexibility across various asynchronous implementations, delivering significant benefits to developers.
The design time and runtime refer to distinct phases in the lifecycle of an event-driven system, each serving distinct purposes:
Design time: This phase occurs during the design and development of the event-driven system, where architects and developers plan and structure the system engaging in activities around:
The design phase yields assets, including a well-defined and configured messaging infrastructure. This encompasses components such as brokers, queues, topics/channels, schemas, and security settings, all tailored to meet specific requirements. The nature of these assets may vary based on the choice of the messaging system.
Runtime: This phase occurs when the system is in operation, actively processing events based on the design-time configurations and settings, responding to triggers in real time.
The output of this phase is the ongoing operation of the messaging platform, with messages being processed, routed, and delivered to subscribers based on the configured settings.
AsyncAPI plays a pivotal role in the asynchronous API design and documentation. Its significance lies in standardization, providing a common and consistent framework for describing asynchronous APIs. AsyncAPI details crucial aspects such as message formats, channels, and protocols, enabling developers and stakeholders to understand and integrate with asynchronous systems effectively.
It should also be noted that the AsyncAPI specification serves as more than documentation; it becomes a communication contract, ensuring clarity and consistency in the exchange of messages between different components or services. Furthermore, AsyncAPI facilitates code generation, expediting the development process by offering a starting point for implementing components that adhere to the specified communication patterns.
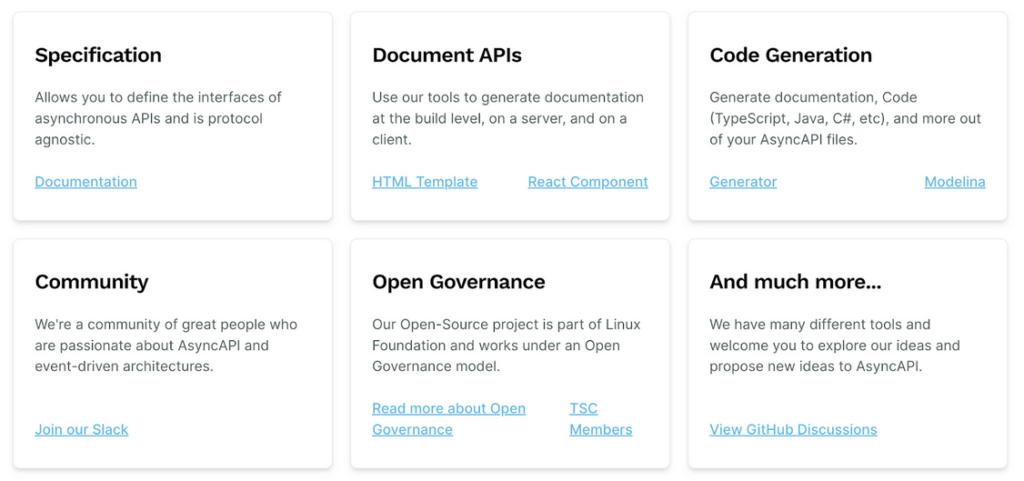
In essence, AsyncAPI helps bridge the gap between design-time decisions and the practical implementation and operation of systems that rely on asynchronous communication.
Let’s explore a scenario involving the development and consumption of an asynchronous API, coupled with a set of essential requirements:
This workflow ensures that design-time and runtime components remain in sync consistently. The feasibility of this process is grounded in the use of the AsyncAPI for the API documentation. Additionally, the AsyncAPI tooling ecosystem supports validation and code generation that makes it possible to keep the design time and runtime in sync.
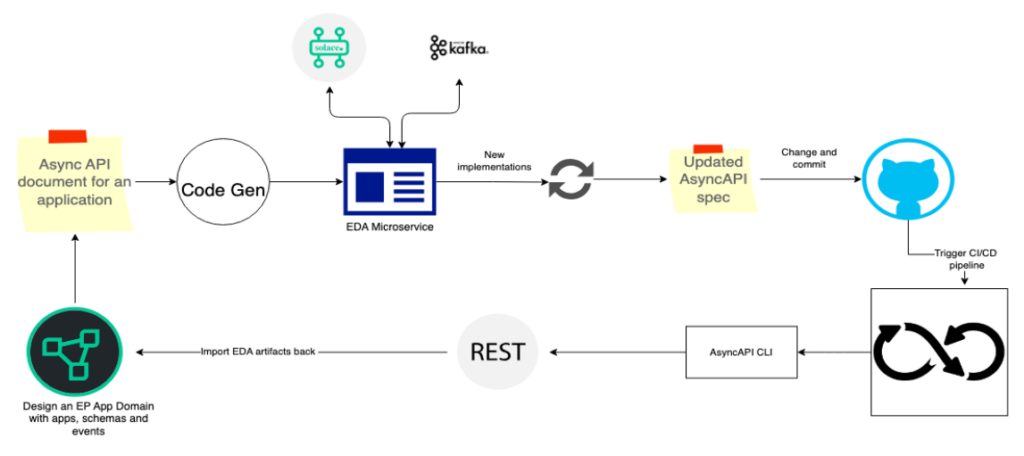
Let us consider Solace Event Portal as the tool for building an asynchronous API and Solace PubSub+ Broker as the messaging system.
An event portal is a cloud-based event management tool that helps in designing EDAs. In the design phase, the portal facilitates the creation and definition of messaging structures, channels, and event-driven contracts. Leveraging the capabilities of Solace Event Portal, we model the asynchronous API and share the crucial details, such as message formats, topics, and communication patterns, as an AsyncAPI document.
We can further enhance this process by providing REST APIs that allow for the dynamic updating of design-time assets, including events, schemas, and permissions. GitHub actions are employed to import AsyncAPI documents and trigger updates to the design-time assets.
The synchronization between design-time and runtime components is made possible by adopting AsyncAPI as the standard for documenting asynchronous APIs. The AsyncAPI tooling ecosystem, encompassing validation and code generation, plays a pivotal role in ensuring the seamless integration of changes. This workflow guarantees that any modifications to the AsyncAPI document efficiently translate into synchronized adjustments in both design-time and runtime aspects.
Keeping the design time and runtime in sync is essential for a seamless and effective development lifecycle. When the design specifications closely align with the implemented runtime components, it promotes consistency, reliability, and predictability in the functioning of the system.
The adoption of the AsyncAPI standard is instrumental in achieving a seamless integration between the design-time and runtime components of asynchronous APIs in EDAs. The use of AsyncAPI as the standard for documenting asynchronous APIs, along with its robust tooling ecosystem, ensures a cohesive development lifecycle.
The effectiveness of this approach extends beyond specific tools, offering a versatile and scalable solution for building and maintaining asynchronous APIs in diverse architectural environments.
Author
Post contributed by Giri Venkatesan, Solace

Save up to 50% on IT Professional Programs, Bundles, and more!
Learn more at training.linuxfoundation.org
In basic terms, an event-driven architecture (EDA) is a distributed system that involves moving data and events between microservices in an asynchronous manner with an event broker acting as the central nervous system in the overall architecture. It is a software design pattern in which decoupled applications can asynchronously publish and subscribe to events via an event broker.
In an increasingly event-driven world, enterprises are deploying more messaging middleware solutions comprising networks’ message broker nodes. These networks route event-related messages between applications in disparate physical locations, clouds, or even geographies. As the enterprises grow in size and maturity in their EDA deployment, it gets more and more challenging to diagnose problems simply by troubleshooting an error message or looking at a log. This is where distributed tracing comes to the rescue by providing system administrators with observability and the ability to trace the lifecycle of an event as it travels between microservices and different API calls and hops within event brokers through the entire event mesh—composed of a network of connected brokers located close to the publishers and subscribers.
To achieve full observability in any system, there is one very important assumption that needs to be satisfied: every component in the system MUST be able to generate information about what’s happening with it and its interaction with other components. So, a transactional event that is composed of multiple hops between different systems and / or interfaces would require the release of trace information on every hop from every interface. A missing step in trace generation results in an incomplete picture in the lifecycle of the transactional event. Pretty straightforward. However, complexity knocks on the door when dealing with event brokers in an EDA system.
To understand why it’s complex to instrument event broker, let us take a look at the three levels at which traces can be collected in a distributed event-driven system:
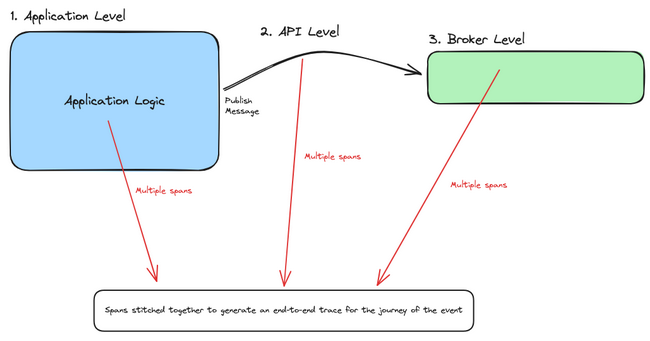
As the business evolves in both scale and routing sophistication, it becomes more critical to have visibility into exactly how messages are being processed by the underlying message brokering topology. Without observability at the broker / routing tier, here are some questions an enterprise cannot answer:
As the industry standard and vendor- and tool-agnostic framework for managing telemetry data, OpenTelemetry (OTel) is the de facto go-to for answering all observability-related questions in the overall architecture. And in the spirit of adding more observability to the system, EDA needs OTel to solve mysteries to answer the previous questions and get a better idea of where things went wrong or what needs to be improved within the path of the transactional event.
The OTel ecosystem has reached a high level of maturity for tools and processes that generate and collect trace information at the application and API levels. With that being said, there are still some gaps in the industry when it comes to collecting metrics from event brokers in event-driven systems on the event-broker level. As stated in the semantic conventions for messaging spans in the OTel documentation, messaging systems are not standardized, meaning there are vendor-specific customizations on how to deal with trace generation from within the system. The design of event broker technologies has not historically supported OTel natively within the broker, hence leaving the broker component in the EDA system as a “Black Box,” where the limits of instrumentation with a message broker are reached along the boundaries of the broker: message in and message out.
As mentioned previously, to achieve complete visibility in a distributed EDA system, every component needs to generate trace information to the OTel collector, including the message broker. To support tracing within the OTel collector and the broker, a dedicated receiver in the collector needs to translate messaging-specific activities to telemetry data. To demonstrate how the messaging component in an EDA system could be instrumented, I will use the Solace PubSub+ Event Broker as an example for the rest of the article.
The Solace PubSub+ Event Broker is an advanced event broker that enables real-time, high-performance messaging in an EDA system running in cloud, on-premises, and hybrid environments. In an effort to bridge the observability gap within the event broker in an EDA system, Solace has native support in the OTel Collector through a Solace receiver. As applications start publishing and consuming guaranteed messages to and from the event broker, spans are generated from the application and API level using OTel SDK libraries and from the broker reflecting every hop inside the broker and within the event mesh. Activities such as enqueuing from publishing, dequeuing from consuming, and acknowledgment will generate spans that the OTel collector consumes and processes.
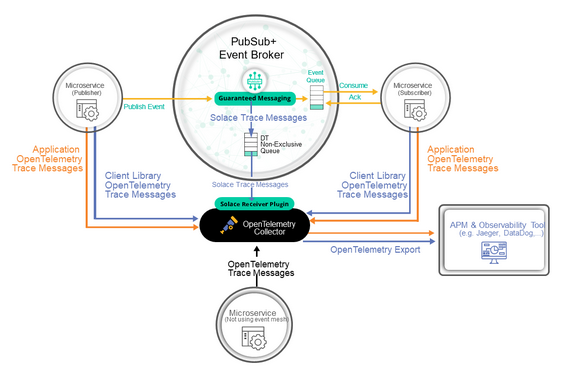
The above diagram shows the basic components of distributed tracing for a single event broker:
This is any piece of software that communicates with the Solace PubSub+ Event Broker via either the native element management protocol or via any of the standard messaging protocols within the supported languages and messaging protocols.
The core event broker with an activated distributed tracing functionality.
A version of the OTel Collector that contains the Solace receiver.
An observability tool / product that consumes OTel traces (e.g., Jaeger, DataDog, Dynatrace, etc.).
Thanks to the standardization of trace messages using the OTel Protocol (OTLP), after the spans are received by the Solace receiver on the OTel collector, they are processed to standardized OTel trace messages and passed to exporters. The exporter is a component in the collector that supports sending data to the backend observability system of choice. We can now get more visibility into the lifecycle of a transactional event in an EDA system as it propagates through the event broker(s) and the different queues within.
Note that once a single Solace PubSub+ Event Broker is configured for distributed tracing, this same configuration can be utilized for every event broker you connect within an event mesh.
For Java-based applications, it is common practice to dynamically inject telemetry information for any call an application does without the need to manually change business logic by simply running an agent alongside the application. This approach is known as automatic instrumentation and is used to capture telemetry information at the “edges” of a microservice. More details on how to download the Java agent can be found here.
After installing the Java agent, run the Solace producing application as follows:
java -javaagent:<absolute_path_to_the_jar_file>/opentelemetry-javaagent.jar \
-Dotel.javaagent.extensions=<absolute_path_to_the_jar_file>/solace-opentelemetry-jms-integration-1.1.0.jar \
-Dotel.propagators=solace_jms_tracecontext \
-Dotel.exporter.otlp.endpoint=http://localhost:4317 \
-Dotel.traces.exporter=otlp \
-Dotel.metrics.exporter=none \
-Dotel.instrumentation.jms.enabled=true \
-Dotel.resource.attributes=“service.name=SolaceJMSPublisher” \
-Dsolace.host=localhost:55557 \
-Dsolace.vpn=default \
-Dsolace.user=default \
-Dsolace.password=default \
-Dsolace.topic=solace/tracing \
-jar solace-publisher.jar
Similarly, run the consuming application as follows:
java -javaagent:<absolute_path_to_the_jar_file>/opentelemetry-javaagent.jar \
-Dotel.javaagent.extensions=<absolute_path_to_the_jar_file>/solace-opentelemetry-jms-integration-1.1.0.jar \
-Dotel.propagators=solace_jms_tracecontext \
-Dotel.traces.exporter=otlp \
-Dotel.metrics.exporter=none \
-Dotel.instrumentation.jms.enabled=true \
-Dotel.resource.attributes=“service.name=SolaceJMSQueueSubscriber” \
-Dsolace.host=localhost:55557 \
-Dsolace.vpn=default \
-Dsolace.user=default \
-Dsolace.password=default \
-Dsolace.queue=q \
-Dsolace.topic=solace/tracing \
-jar solace-queue-receiver.jar
What happens behind the scenes when an application uses the JMS Java API to publish or subscribe on the event broker is that the OTel Java Agent intercepts the call with the help of the Solace OTel JMS integration extension and generates spans to the OTLP receiver in the OTel collector. This generates spans on the API level. Broker-level spans are generated from the Solace PubSub+ Event Broker upon arrival of the message on the broker after it’s enqueued. The collector generates and receives further broker-specific spans in the collector and processes them into the OTel-specific format. All the generated spans from the different steps are then exported and stitched for further processing.
The following figure illustrates the details of the inner workings of the Java auto-instrumentation agent:
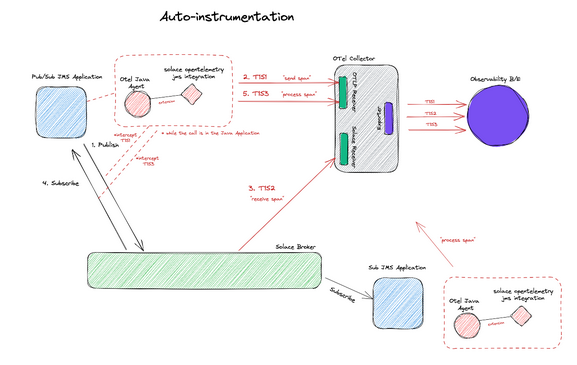
The advantage of such an approach is that the Java auto-instrumentation agent takes care of span generation on the API level without the need for code changes or application business logic configuration. The drawback is that you can’t add further customization on the different spans generated to get a more detailed picture of what’s happening in the business logic of the microservice.
In some cases, developers want to have more control over when spans are generated and what attributes are included in the span during the business logic of the microservice, hence they generate application-level traces. This is done using the OTel SDK and broker-specific APIs that support span generation and context propagation.
Developers can interact with the event broker through APIs in multiple languages. In the following example, I will be using the latest Java API for the Solace Messaging Platform, also known as JCSMP, which supports span generation and context propagation for distributed tracing. For a publishing application to support manual instrumentation directly from the business logic, the following needs to be done:
import com.solace.messaging.trace.propagation.SolaceJCSMPTextMapGetter;
import com.solace.messaging.trace.propagation.SolaceJCSMPTextMapSetter;
import com.solace.samples.util.JcsmpTracingUtil;
import com.solace.samples.util.SpanAttributes;
import com.solacesystems.jcsmp.*;
import io.opentelemetry.api.trace.Span;
import io.opentelemetry.api.trace.SpanKind;
import io.opentelemetry.api.trace.StatusCode;
import io.opentelemetry.context.Scope;
import io.opentelemetry.context.propagation.TextMapPropagator;
import io.opentelemetry.context.Context;
final SolaceJCSMPTextMapGetter getter = new SolaceJCSMPTextMapGetter();
final Context extractedContext = JcsmpTracingUtil.openTelemetry.getPropagators().getTextMapPropagator()
.extract(Context.current(), message, getter);
final Span sendSpan = JcsmpTracingUtil.tracer
.spanBuilder(SERVICE_NAME + ” ” + SpanAttributes.MessagingOperation.SEND)
.setSpanKind(SpanKind.CLIENT)
.setAttribute(SpanAttributes.MessagingAttribute.DESTINATION_KIND.toString(),
SpanAttributes.MessageDestinationKind.TOPIC.toString())
.setAttribute(SpanAttributes.MessagingAttribute.IS_TEMP_DESTINATION.toString(), “true”)
//Set more attributes as needed
.setAttribute(“myKey”, “myValue” + ThreadLocalRandom.current().nextInt(1, 3))
.setParent(extractedContext) // set extractedContext as parent
.startSpan();
final SolaceJCSMPTextMapSetter setter = new SolaceJCSMPTextMapSetter();
final TextMapPropagator propagator = JcsmpTracingUtil.openTelemetry.getPropagators().getTextMapPropagator();
propagator.inject(Context.current(), message, setter);
producer.send(message, topic);
That’s it! The following figure illustrates the details of how manual instrumentation is achieved from the application level:
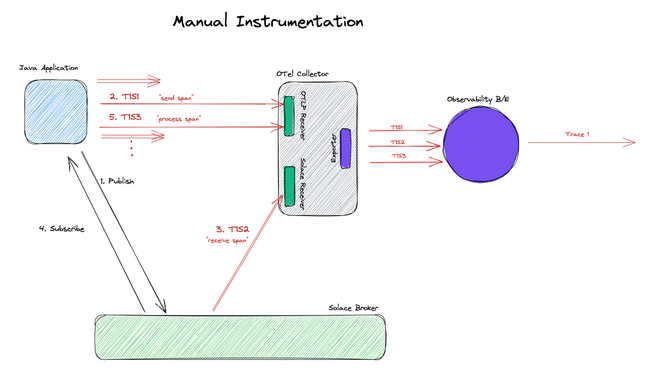
The advantage of such an approach is having full control over what attributes are included in the generated span and when the span is generated. A developer also has control over generating other custom spans that are not related to messaging. It is, however important to note that this adds further complexity in application development, and the order of span generation becomes an implementation detail.
In conclusion, the Solace PubSub+ Event Broker is one of the many existing message-broker technologies that could be used for communication in EDA systems. The OpenTelemetry project helps to answer observability-related questions in the system from an application and API level. Broker-level instrumentation requires vendor-specific customization to define the activities within the broker that result in span generation. There are two approaches to generating spans in an EDA system: auto-instrumentation and manual instrumentation. Using the Solace PubSub+ Event Broker within an EDA system, you can get more visibility on what happens to the message within the broker during the lifecycle of a transactional event.
For more information on how to configure a distributed tracing-enabled event mesh with auto and manual instrumented applications, you can take a look at this step-by-step tutorial. For further resources on OTel and how it fits in a distributed EDA system, check out this short video series. And if you’re interested in learning more about how Solace supports open source initiatives, visit the CNCF resources page for Solace.
Happy coding!
Author

Contributed by
Tamimi Ahmad, Solace
Innovation—a term often tossed around but rarely dissected for its true impact, especially in the ever-evolving world of telecommunications. At its core, innovation is about breaking new ground; it’s about moving beyond traditional methods to create novel solutions for old problems and to anticipate challenges in an ever-changing industry.
Innovation in telecommunications isn’t just about adopting the latest technology; it’s a mindset. It’s the willingness to challenge the status quo, to rethink processes, and to be open to change. True innovation lies in the ability to blend creativity with practicality to address the industry’s current and future needs.
The telecom industry, characterized by rapid technological advancements and changing consumer behaviors, demands continuous innovation. Stagnation leads to obsolescence. Companies must innovate not only to solve existing problems but also to preemptively tackle potential future challenges. This proactive approach keeps companies ahead of the curve, ensuring that they don’t just survive but thrive.
Network automation emerges as a pivotal tool for innovation in telecommunications. It’s not just about deploying isolated use cases; it’s about equipping teams with a comprehensive suite of tools that foster an environment where the majority of their energy can be focused on creative processes.
The true power of network automation lies in its ability to free up valuable resources. Automating routine and repetitive tasks allows engineers and developers to concentrate on creative problem-solving and innovative thinking. It’s not merely about having technology at one’s disposal; it’s about having the right technology that empowers teams to think beyond day-to-day operations.
Implementing network automation requires more than just technological adoption; it requires a cultural shift. This shift involves embracing a culture of experimentation, where failure is seen as a stepping stone to success and out-of-the-box thinking is encouraged.
Innovation in telecommunications, fueled by network automation, is not a one-time initiative but a continuous journey. It’s about creating an ecosystem that nurtures creativity, encourages experimentation, and continuously pushes the boundaries of what’s possible. As the industry evolves, this approach to innovation will not only solve current problems but also pave the way for future advancements, ensuring that the telecom industry remains at the forefront of technological evolution.
Another crucial aspect of driving innovation in telecommunications is learning from the DevOps movement and open source communities. These domains stand as exemplary models of innovation vehicles. DevOps, with its emphasis on continuous integration, deployment, and collaboration between development and operations teams, provides a blueprint for operational efficiency and agility. This methodology underscores the importance of rapid iteration, feedback, and improvement—principles that are essential for fostering innovation in telecom.
Similarly, open source communities offer invaluable insights into the power of collaboration and shared knowledge. These communities thrive on the principles of openness, transparency, and collective problem-solving, which can significantly accelerate the pace of innovation. By adopting these principles, telecom companies can tap into a vast pool of knowledge and expertise, breaking down silos and fostering a more collaborative and innovative environment. The open source model encourages a culture where ideas are freely exchanged and solutions are developed collaboratively, leading to more robust and creative outcomes.
Incorporating these lessons from DevOps and open source communities into the fabric of network automation and telecommunications can lead to transformative changes. It’s about building a culture that values continuous learning, collaboration, and openness—key ingredients for sustained innovation and progress in the dynamic world of telecom.
Telecommunications plays a role in every major innovation of the 21st century. From driving global connectivity to enabling new technologies, telcos are the backbone of our digital age. The integration of network automation, along with lessons learned from DevOps and open source, will not only reshape telecommunications but pave the way for technological breakthroughs unimaginable today. We are on the verge of unlocking potential that will transform the way we live, work, and connect. Telecommunications is not just an industry; it is the enabler of an unprecedented era of innovation.
Guest Post By
Iquall Networks
https://iquall.net/
Welcome to the Linux Foundation’s January newsletter! In this edition you’ll find new research reports, key LF Project updates, and our first Training & Certification deal of the year. Also, if you missed it, we published our 2023 Annual Report in December, “Rising Tides of Open Source.” We thank you for your continued support of the Linux Foundation and look forward with excitement as we continue our Open Source journey together in 2024.
Read More at linuxfoundation.org
Log centralization and analysis are crucial for organizations in troubleshooting system errors, identifying cybersecurity threats, and adhering to various regulations such as The Health Insurance Portability and Accountability Act (HIPAA), Gramm-Leach-Bliley Act (GLBA), Payment Card Industry Data Security Standards (PCI), Cybersecurity Maturity Model Certification (CMMC), and more. While contemporary SIEM solutions have simplified log management, features like threat intelligence and advanced event correlation are often restricted to paid, closed-code systems. This article will walk you through deploying log collectors, a comprehensive log management solution, and correlation rules using UTMStack, an open source and free SIEM and XDR solution, for effective threat detection, system error identification, and automated remediation.
Deploying UTMStack for log centralization and analysis involves three main components: log collectors aka agents, a central server for log centralization, and correlation rules for detection and incident response.
Agents: These collect logs from systems and execute local and remote incident response commands. Agents can also function as proxies for collecting syslog and netflow logs from network devices.
Central Server: This server stores and correlates logs from various assets like other servers and firewalls to identify potential threats and orchestrates incident responses across the IT ecosystem.
Correlation rules and Incident Response: These detect possible threats to system security and availability by correlating logs from multiple systems with threat intelligence and predefined malicious sequences of behaviors and compromise indicators. Once a correlation rule evaluates a group of logs as potentially malicious, an alert triggers the incident response command.
The log centralization server can be deployed using an ISO image from the utmstack website for simplicity. For advanced installation options, please visit the official GitHub repository https://github.com/utmstack/UTMStack
Here are the instructions for installing without the ISO on Ubuntu Linux 22.04 LTS.

After installation, access the server via a browser using the server’s IP address or DNS name and the random secure password provided by the installer.
Navigate to the “Integrations” section and select the appropriate agent for your operating system. Additional integrations can be configured as needed.
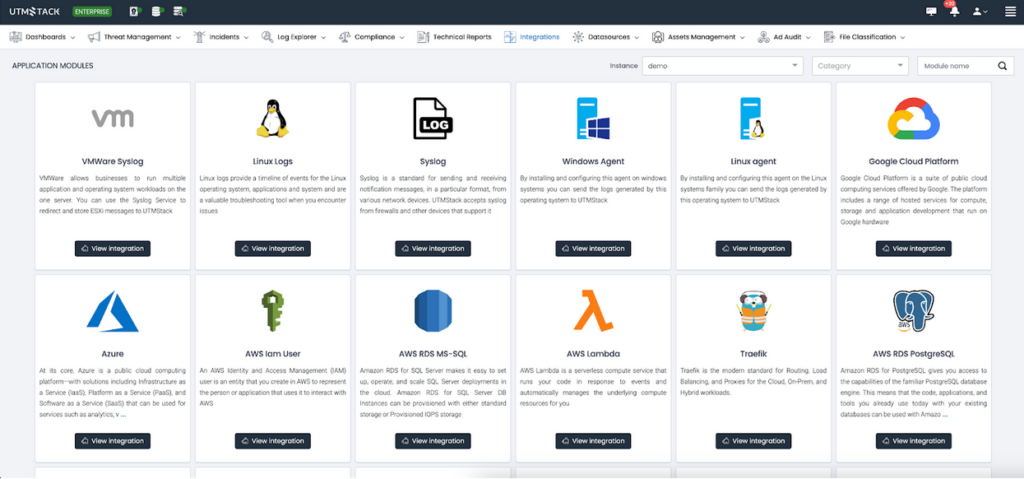
Correlation rules form the core of a log management system, defining which logs or combinations thereof should trigger an alert or incident. UTMStack uses these rules as a basis for Incident Response playbooks.
Let’s take, for instance, a brute-force attack. This type of cybersecurity threat attempts to guess a user’s password by trying massive random combinations of characters until the correct sequence matches the user’s credentials. These types of attacks usually leave behind a trail of logs that indicate a user has failed to log into a system several times in a short period of time.
You can access the complete list of prebuilt correlation rules and the guide to creating new ones from the official UTMStack repository. For this guide, we’ll create a sample correlation rule to detect brute-force attacks.
UTMStack correlation rules are written in plain YAML and have three main components. Threat documentation that describes the rule, defines a tactic category of attack, severity and name of the rule. The second component is the logic and frequency block, where the rules for triggering this alert are defined. Finally, the alert information block, where the information is extracted from the logs and saved into the alert item.
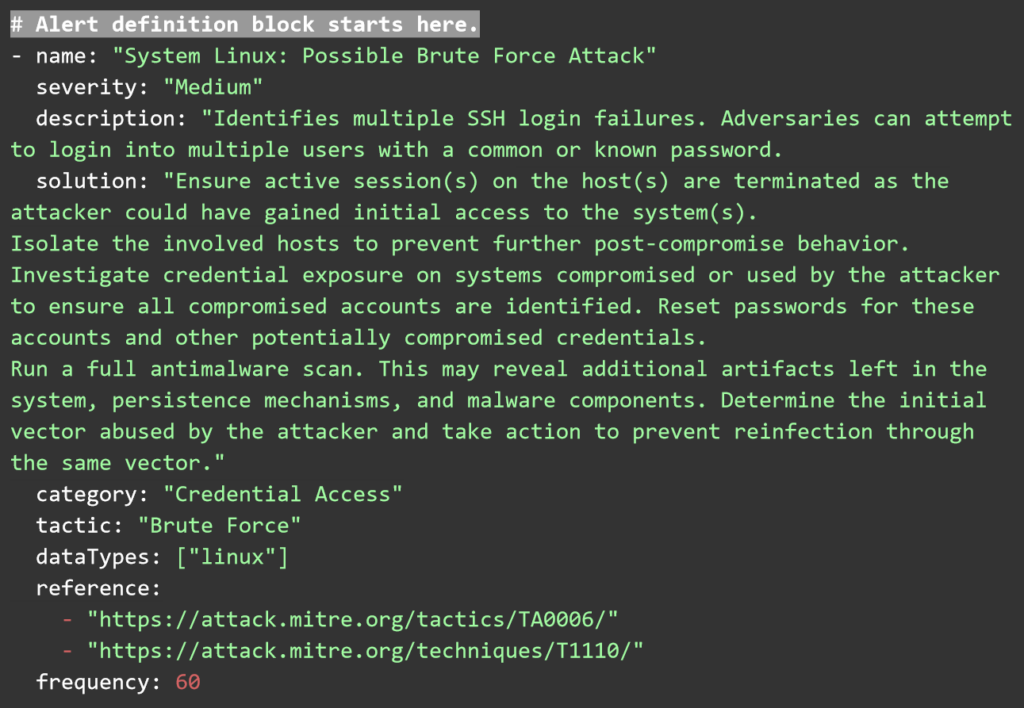
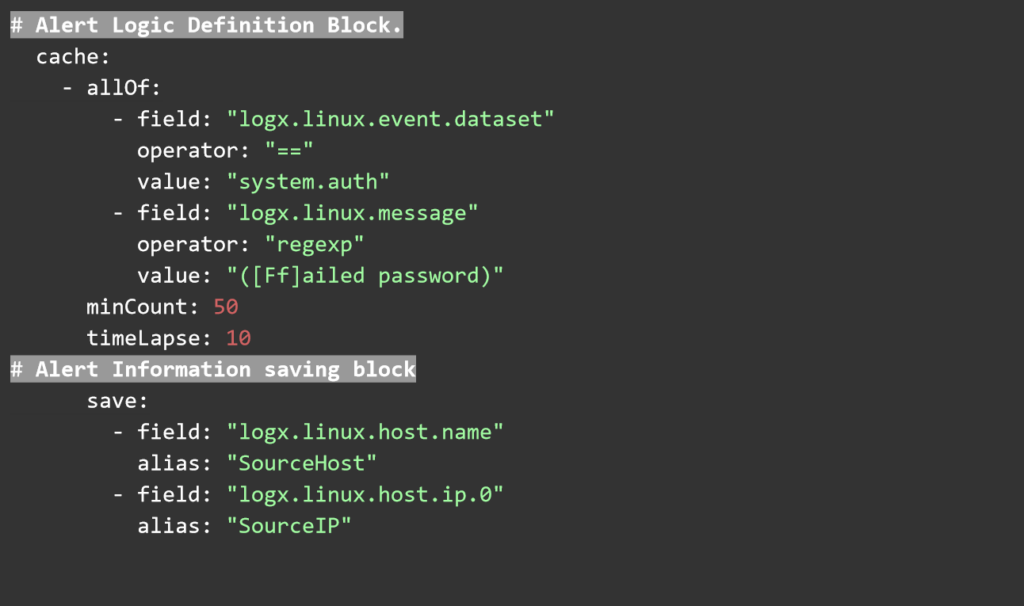
These YAML rules can be saved as text files and copied into the correlation rules folder via the Web User interface. Any rules uploaded there will be processed by the correlation engine automatically.
All logs the system receives are aggregated and correlated for indicators of compromise (IOCs) using several open threat intelligence feeds. This feature is enabled by default, and there is no need for custom correlation rules or configurations.
Finally, to deploy the incident response playbooks, navigate to the incident response automation section and drop a command to disable future login attempts from the offender host. This can be done by blocking its IP in the firewall or disabling the victim user until further investigation can be done.
UTMStack’s Incident response commands use dynamic variables to handle the execution of commands with different targets. Here are some examples.
Command to block a user:usermod -L ${source.user}
Command to block an IPiptables -A INPUT -s ${source.ip} -j DROP
Log centralization and analysis are essential for security, availability, and compliance. Open source tools can deliver advanced flexibility and rich feature sets to meet complex use cases and deliver an enterprise-ready experience. The UTMStack open source project is a powerful SIEM and XDR system that can deliver log management, threat detection and incident response by correlating and aggregating logs in real-time. Advanced features such as IOC detection, threat intelligence, and compliance are built-in features of the security stack.
Join Our Community and Contribute
We’re always looking for passionate individuals to contribute to our project. Whether you’re a developer, security expert, or just enthusiastic about cybersecurity, your input is valuable. Here’s how you can get involved:
GitHub Repository: Visit our GitHub repository to explore our code, submit issues, or contribute enhancements. Your code contributions can help us improve and expand UTMStack’s capabilities.
Discord Channel: Join our Discord community to discuss with fellow contributors, share ideas, and collaborate on projects. It’s a great place to learn from others and contribute your expertise.
Online Chat and Forums: For quick questions or discussions, use the online chat feature on our official website or the forums. It’s a direct line to our team and community for real-time interactions.
Your contributions, big or small, play a crucial part in the development and improvement of UTMStack. Together, we can build a stronger, more secure open-source SIEM & XDR solution. Join us today and help shape the future of cybersecurity!

Rick Valdes
Founder, UTMStack
Waiting for pulling into the mainline kernel once Linus Torvalds is back online following Portland’s winter storms is the sound subsystem updates for Linux 6.8, which include a lot of new sound hardware support.
Linux sound subsystem maintainer Takashi Iwai at SUSE describes the new sound hardware support for Linux 6.8 as:
“Support for more AMD and Intel systems, NXP i.MX8m MICFIL, Qualcomm SM8250, SM8550, SM8650 and X1E80100”
Read more at Phoronix
Get Started on Your 2024 Career Resolutions with Savings up to 35%
*Offer ends January 23, 2024
Learn more at training.linuxfoundation.org

Today is a big day for OpenTofu! After four months of work, we’re releasing the first stable release of OpenTofu, a community-driven open source fork of Terraform. OpenTofu, a Linux Foundation project, is now production-ready. It’s a drop-in replacement for Terraform, and you can easily migrate to it by following our migration guide.
Read more at opentofu.org